Interactive Manual ROI Labeler
The interactive preprocessing summary lets a reviewer mark each ROI as Good, Bad, Unsure, or Unlabeled by inspecting its morphology and dF/F trace. It also provides filtering and sorting utilities of ROIs based on metrics calculated from morphology, dF/F, and inferred spikes, and summaries of motion correction for a given session.
Interactive Reviewer Features and Layout
1. Full reviewer layout
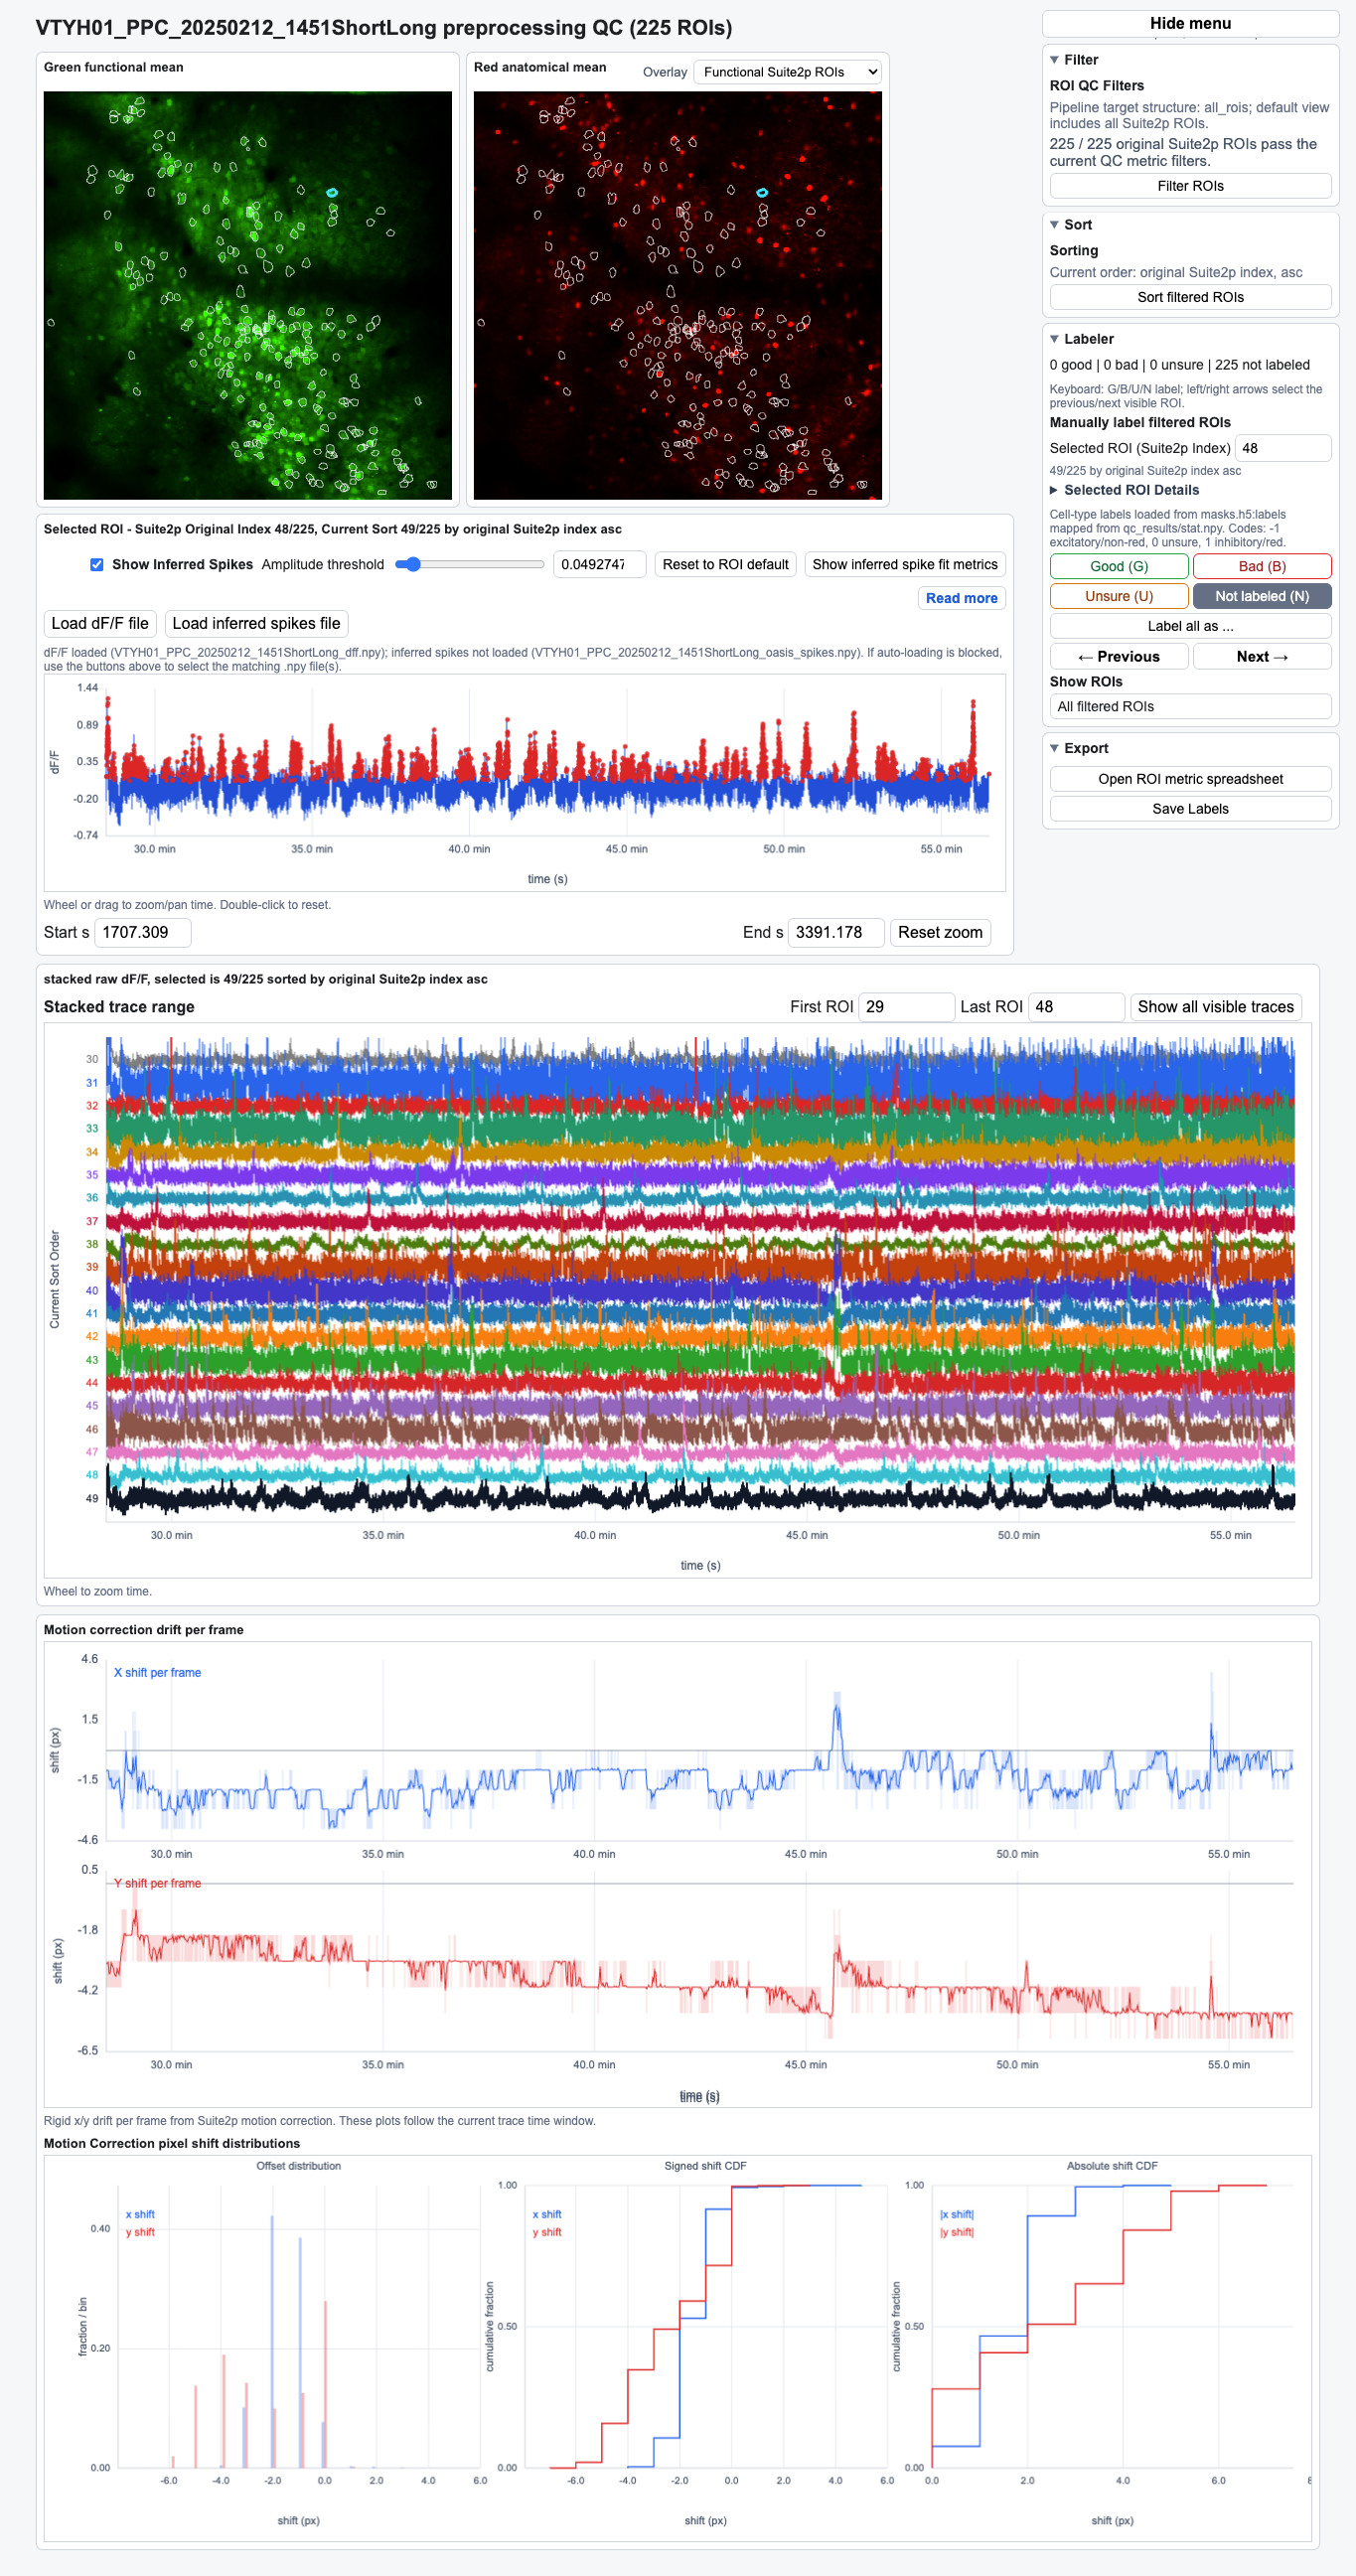
The reviewer is organized as a single interactive workspace that combines image-based ROI inspection, trace review, filtering, labeling, and export. The top of the layout contains the FOV image with Suite2p ROI outlines overlaid; when anatomical imaging is available, a red-channel panel is shown beside the green functional image. The currently selected ROI is highlighted in cyan so it can be matched across the image, selected trace, and stacked trace panels.
The right-side menu contains the major reviewer controls: Filter, Sort, Labeler, and Export. Below the image area, the reviewer shows the single-ROI dF/F trace, the stacked trace panel, the inferred-spike overlay and diagnostic controls when those data are available, and motion-correction plots. The following sections describe each component in more detail.
2. FOV ROI selection
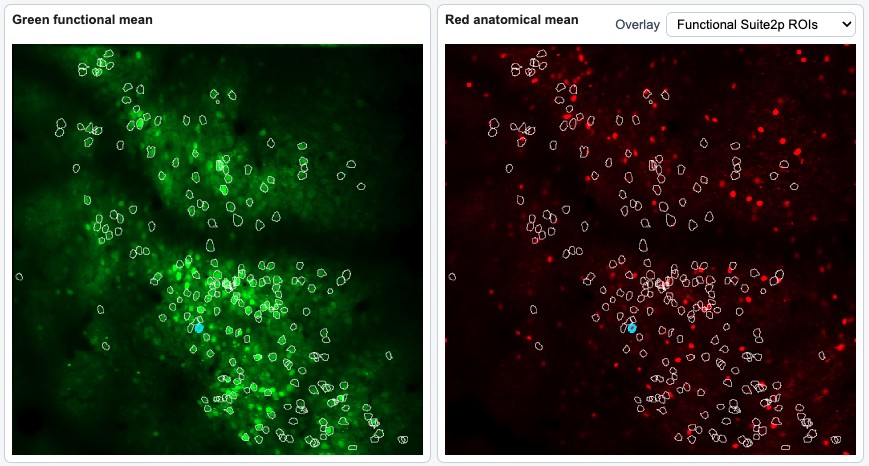
The FOV ROI selection panel shows the green functional mean image and, when available, an optional red-channel anatomical panel. Clickable outlines on the green functional image correspond to the ROI masks detected by Suite2p. The selected ROI outline is emphasized in cyan, providing a spatial reference for the trace and metric information elsewhere in the reviewer.
When filters are applied, ROI masks that do not pass the active filter are removed from the FOV panel. They can be viewed again by clearing filters or using the control to show all ROIs. This makes the FOV panel a direct visual representation of the current filtered ROI population.
Scroll and drag interactions support zooming and panning around dense ROI
fields. When anatomical masks are present from a Cellpose run in masks.h5,
they can be viewed on the anatomical mean image with the Overlay dropdown.
Those anatomical masks are displayed for spatial comparison but are not
selectable in the current reviewer, which supports one selected mask and dF/F
trace file at a time.
3. Manual label controls
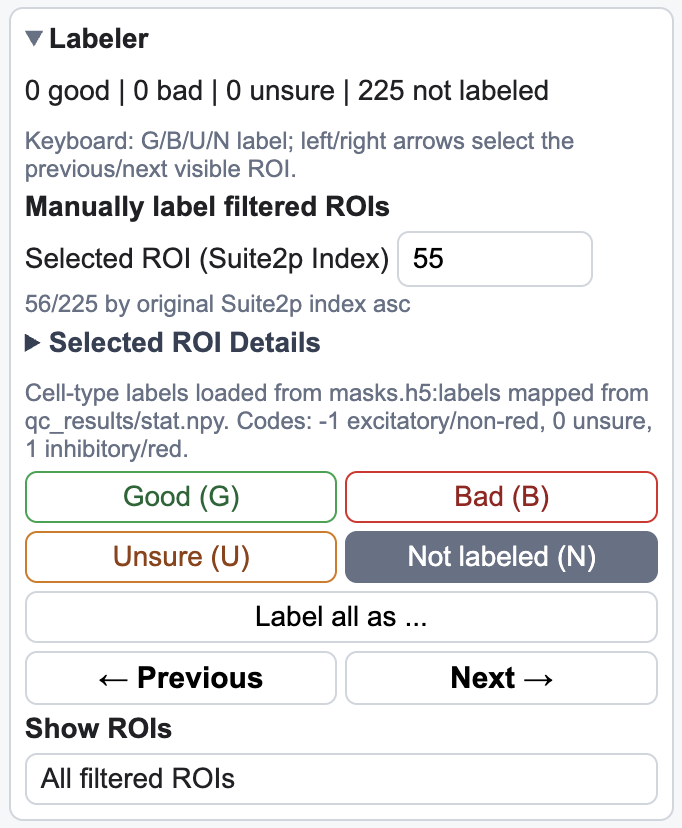
The manual label controls assign the current ROI to one of four reviewer
states: Good, Bad, Unsure, or Not labeled. The button
corresponding to the current ROI's label is filled with color, and the keyboard
shortcuts G, B, U, and N provide faster entry for repeated review.
The label counts summarize all ROIs in the session, not only the ROIs currently passing filters. When filters are applied, failing ROIs are automatically labeled Bad and are not visible or selectable in the filtered view, but they are still included in the Bad count. Reviewers can still manually revise labels after filters have been applied.
The Previous and Next controls, along with the left and right arrow keys, move through ROIs in the current sort order. Only ROIs that pass the active filters are included in this navigation set. The default ordering is the ascending Suite2p ROI index, or row order when a non-Suite2p input layout is used, and the default label for passing ROIs is Not labeled. The Selected ROI index identifies the ROI within the session and persists across sorting operations, while the displayed position indicates where that ROI falls in the current sort order. Selected ROI Details can be expanded to show morphology, dF/F, and inferred-spike summary metrics, and Label all as ... supports bulk labeling of multiple visible ROIs.
4. Show ROIs by label
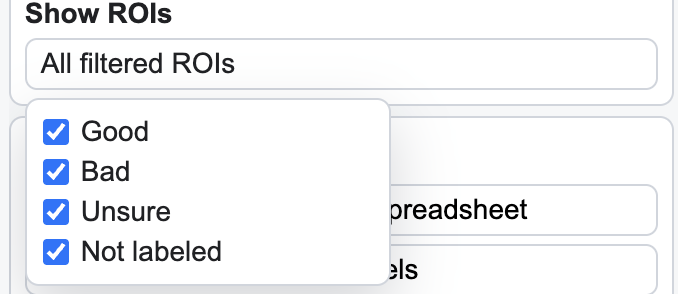
The Show ROIs controls toggle visibility for Good, Bad, Unsure, and Not labeled ROIs. These display controls change what appears in the reviewer and which ROIs are included in navigation, but they do not change saved manual labels.
This visibility setting operates after the active QC filters. ROIs excluded by the filter are automatically labeled Bad, but they are not visible or selectable simply because Bad ROIs are enabled in the Show ROIs menu. To view filtered-out ROIs, the relevant QC filter must be removed or reset.
5. ROI QC filters
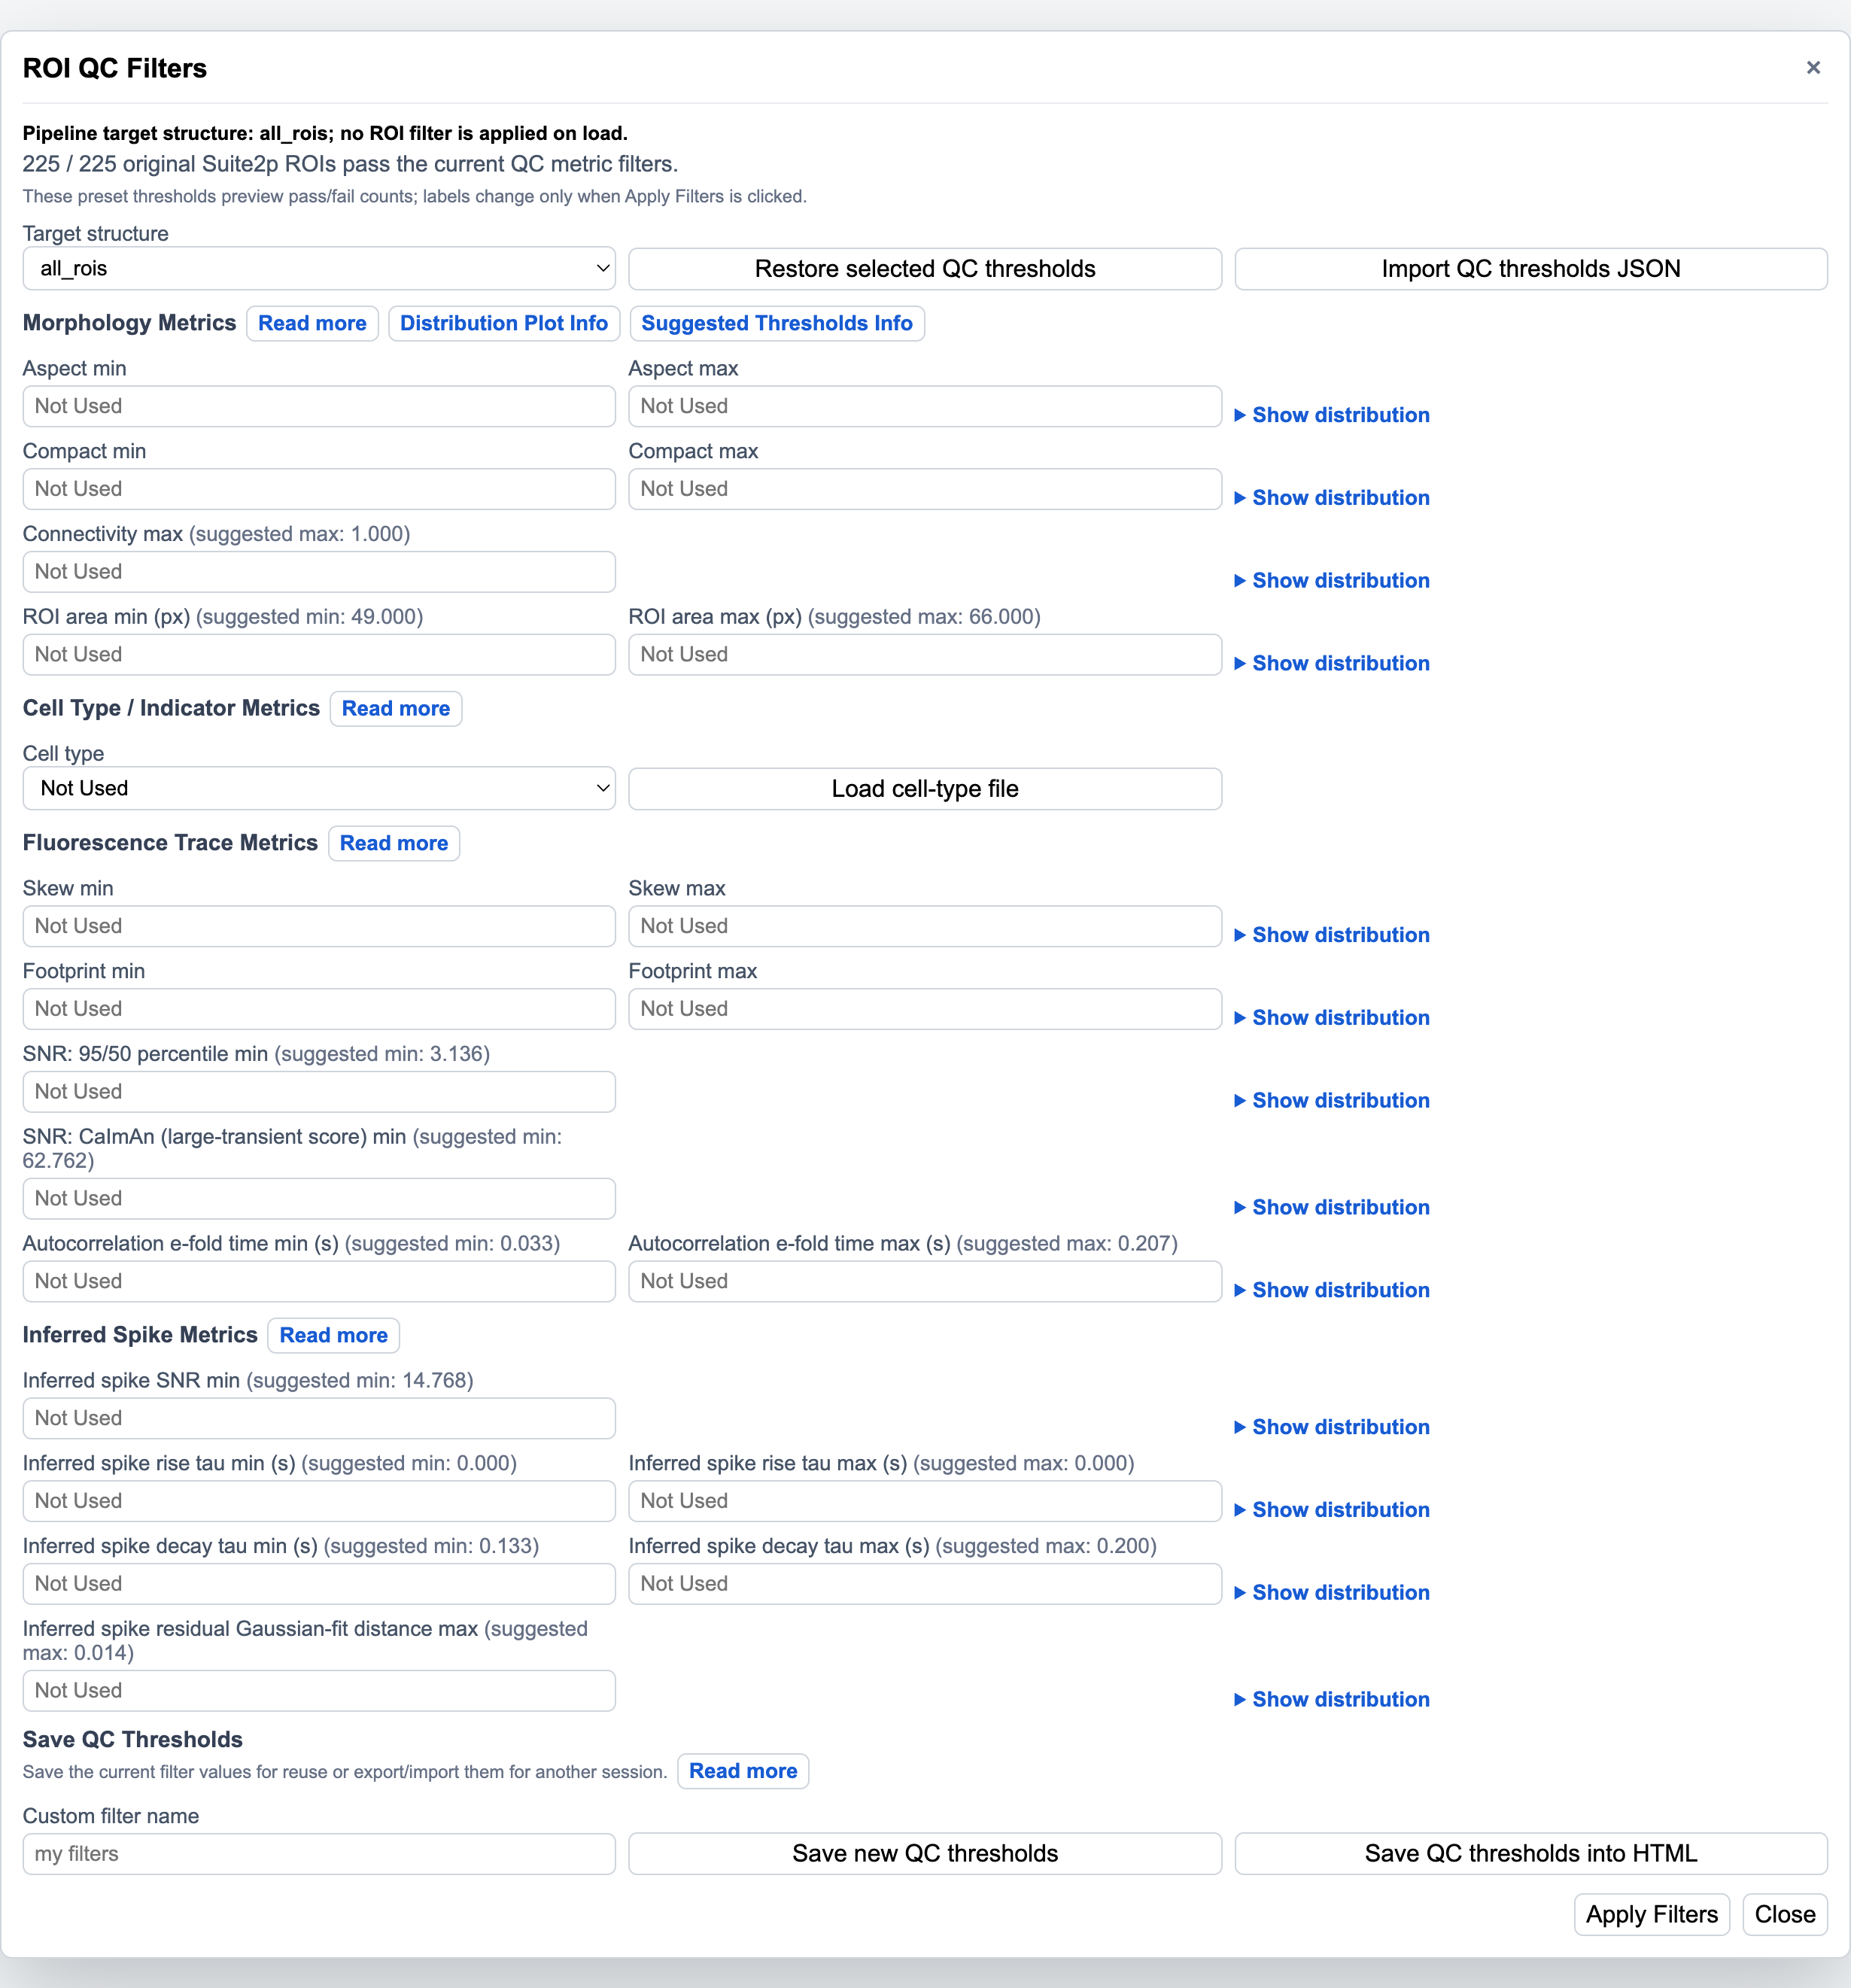
The ROI QC Filters menu previews which ROIs pass the active QC thresholds. By default, no thresholds are active and all ROIs pass. Editing a threshold field immediately updates the pass/fail count and the visible ROI set, but it does not change manual labels until Apply Filters is clicked. Empty threshold fields are treated as unused filters.
The Target structure dropdown loads built-in QC threshold presets, such as all ROIs, soma, dendrite, or other presets that are embedded in the generated HTML or imported by the reviewer. Restore selected QC thresholds reloads the currently selected preset and discards unsaved edits in the threshold fields. Custom saved threshold sets also appear in this dropdown under their saved names.
The filter menu is organized into three main metric categories. Morphology metrics describe ROI shape and mask quality, and are intended to identify implausible shapes, fragmented masks, unusually small or large footprints, or morphology values outside the chosen target-structure preset. Fluorescence trace metrics are computed from each ROI's dF/F trace and are intended to identify weak trace structure, trace-quality values outside the expected range, or fluorescence dynamics that do not fit the target ROI class. Inferred spike metrics are computed from OASIS-style inferred-spike outputs when available and describe whether inferred events have reasonable amplitude, timing, and residual structure relative to the dF/F trace. If inferred-spike outputs are not available for a session, those controls may be disabled or marked as unavailable.
The Read more controls document where each metric category comes from and how the reviewer interprets the values. Distribution controls reveal per-metric histograms so threshold choices can be compared with the full ROI population. Suggested thresholds are derived from the ROIs embedded in the current reviewer HTML, making them session-specific starting points rather than fixed lab rules.
Filtering is conjunctive: each ROI must pass every active threshold to pass the current QC filter. Min fields require the ROI metric to be greater than or equal to the entered value, and Max fields require the ROI metric to be less than or equal to the entered value. ROIs with missing or non-finite values fail active thresholds that depend on those values. The menu reports the number of original Suite2p ROIs that pass the active filter.
The Apply Filters button converts the current pass/fail result into manual labels. Passing ROIs are set to Not labeled, while failing ROIs are set to Bad. This action is intentionally separate from threshold editing so reviewers can preview filters before changing labels. After filters are applied, manual labels remain separately editable, and reviewers can still change individual ROIs to Good, Bad, Unsure, or Not labeled. Exported label files preserve the final manual label state, not just the filter result.
5.1. Metric distributions and suggested thresholds
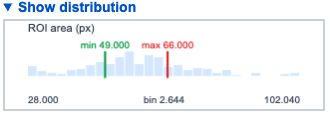
Distribution histograms are available for individual metrics in the filter menu. For fields without suggested thresholds, the plot marks the mean value. For fields with suggested thresholds, the marked values are usually derived from percentiles or related distribution summaries; the Suggest thresholds info and Read more panels describe the metric source and the suggested-threshold semantics.
The vertical threshold markers update as min and max fields are edited, making the histogram a direct preview of how a threshold relates to the full ROI population. Suggested thresholds are computed from the ROIs embedded in the current reviewer HTML, so they should be treated as session-specific guidance rather than fixed exclusion rules.
5.2. Saving and reusing QC thresholds
Save new QC thresholds adds the active threshold settings as a named filter within the current browser session. Save QC thresholds into HTML downloads a reviewer copy of the full HTML labeler with any saved threshold sets from the current session embedded in the file. This is the appropriate option when a reviewer needs to close the browser but later return to the same labeling state, because ROI labels, QC thresholds, and other HTML session state do not automatically modify the source file on disk.
Export QC thresholds JSON is available from the Save Labels dialog on the main menu, and Import QC thresholds JSON loads filter settings in the same format. This provides a lightweight way to reuse threshold sets across sessions or include them in documentation and provenance records.
Example JSON matching the current built-in soma preset. In the code this preset is stored internally as neuron for historical compatibility, but the reviewer displays it as soma. It uses only morphology thresholds; fluorescence trace and inferred spike thresholds are intentionally omitted.
{
  "name": "soma",
  "filter": {
    "skewMin": -5.0,
    "skewMax": 5.0,
    "maxConnect": 1,
    "aspectMin": 0.0,
    "aspectMax": 5.0,
    "footprintMin": 1.0,
    "footprintMax": 2.0,
    "compactMin": 0.0,
    "compactMax": 1.06
  }
}
Fields omitted from the filter object are treated as unused thresholds.
6. Sorting ROIs
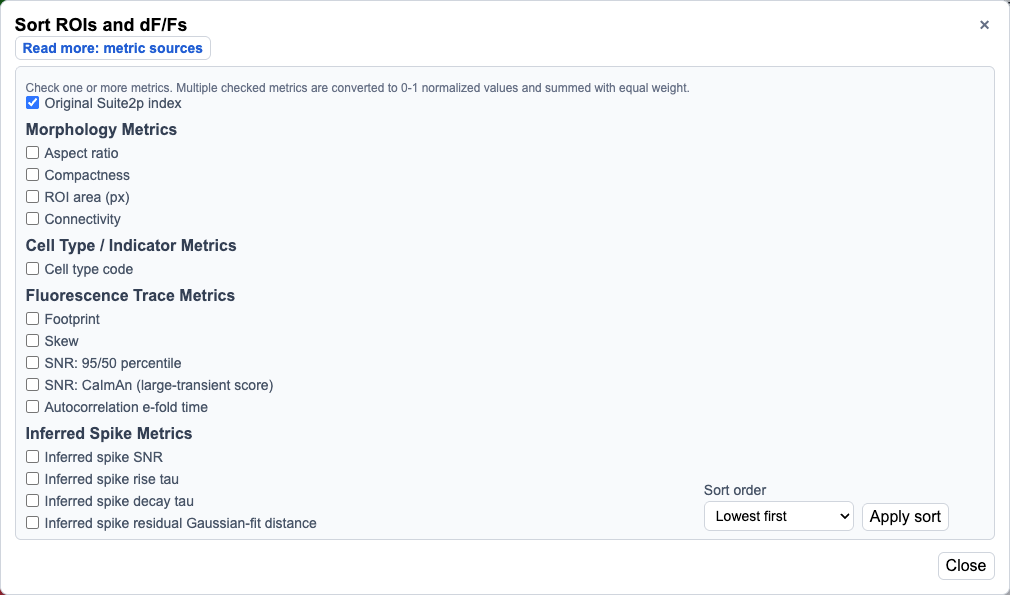
The Sort ROIs dialog orders ROIs by original Suite2p index, row order, or metrics from the same categories used in the ROI QC filters: morphology, fluorescence trace, and inferred-spike metrics. Sorting updates both the selected ROI navigation order and the stacked trace order, making it useful for reviewing ROIs with similar metric values together.
When multiple metrics are checked, each metric is normalized to a 0-1 range and combined with equal weight into a single score across all ROIs. The sort order can be set to lowest-first or highest-first for the final metric or combined score.
When selecting multiple metrics, choose metrics whose direction has the same practical meaning. For example, a lower inferred-spike residual Gaussian-fit distance is generally better, so ascending order usually makes sense for that metric. A higher SNR is generally better, so descending order usually makes sense for SNR. Combining those two directly can be counterproductive because the current sorter does not automatically flip metric directions before combining them. Support may be added later for automatically coherent combinations of metrics with opposite preferred directions, but the current reviewer leaves that choice to the user.
7. Selected ROI dF/F and OASIS overlay
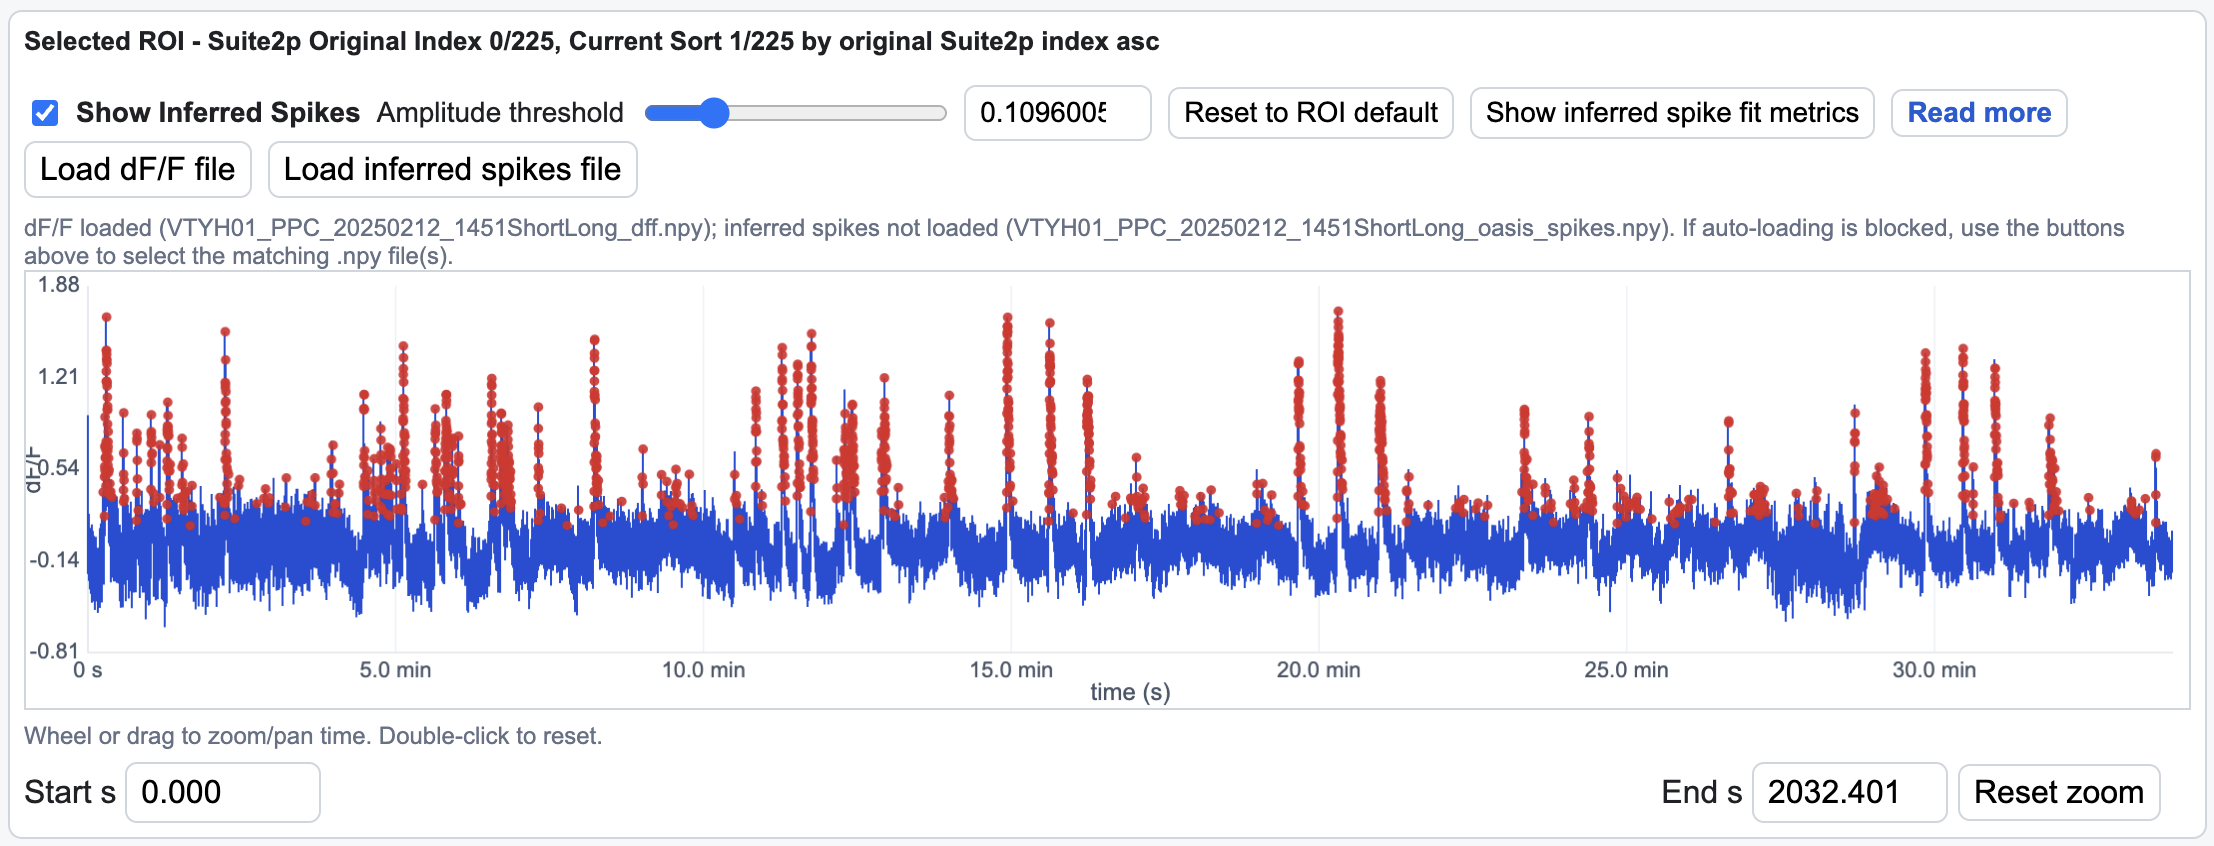
The selected ROI dF/F trace shows the fluorescence trace for the currently selected ROI over the active time window. Wheel and drag interactions zoom or pan through time, and double-clicking resets the view. This time window is shared with other trace-linked panels, allowing the reviewer to inspect the same period across the selected trace, stacked traces, and motion plots.
When inferred-spike data are available, inferred spikes can be toggled on or off over the dF/F trace. The amplitude threshold slider and number input control which inferred-spike amplitudes are displayed. Reset to ROI default restores the precomputed ROI-specific threshold where the event-window residuals most closely resemble Gaussian noise. The Show inferred spike fit metrics button and section 8 provide more detail on how that threshold and its diagnostics are interpreted.
7.1. dF/F and inferred-spike input format
When the preprocessing summary is run on a processed Suite2p session directory,
the reviewer generates the dF/F and inferred-spike inputs automatically. Small
arrays are embedded directly in the HTML. Larger arrays are written beside the
HTML as .npy sidecar files and the browser tries to load them automatically
from the same folder. If browser security blocks that automatic load, use
Load dF/F file and Load inferred spikes file to select the matching
sidecar files manually.
The dF/F sidecar is generated by this repo's preprocessing summary from the
selected input layout: native Suite2p traces
suite2p/plane0/F.npy / suite2p/plane0/Fneu.npy, or filtered
qc_results/fluo.npy / qc_results/neuropil.npy style traces when that layout
is detected or selected explicitly. The neuropil coefficient is read from
ops.npy. The inferred-spikes sidecar is generated from the matching
spikes.h5 when available. Those inferred-spike values may come from Suite2p's
OASIS deconvolution, but the reviewer expects the exported ROI-by-frame
amplitude array rather than a native Suite2p GUI file.
For either autogenerated sidecars or arrays from another upstream processing
workflow, the browser loader expects NumPy .npy files with this layout:
shape = (n_rois, n_frames)

            frame 0   frame 1   frame 2   ...   frame N
ROI 0        value     value     value           value
ROI 1        value     value     value           value
ROI 2        value     value     value           value
...
ROI M        value     value     value           value
Rows are ROIs and columns are imaging frames. The ROI row order must match the ROI order embedded in the reviewer, and the dF/F and inferred-spike arrays should have the same shape and frame count.
The .npy arrays should be C-order, not Fortran-order. Practically, this means
each row stores one ROI's full time series in order:
ROI 0 frame 0, ROI 0 frame 1, ROI 0 frame 2, ...
ROI 1 frame 0, ROI 1 frame 1, ROI 1 frame 2, ...
Most arrays written with np.save() already satisfy this. Force the expected
format before saving if the array came from transposing, slicing, MATLAB-style
processing, or HDF5 conversion. The browser supports little-endian float32
and float64; float64 is converted to float32 after loading.
import numpy as np

dff = np.ascontiguousarray(dff, dtype=np.float32)
spikes = np.ascontiguousarray(spikes, dtype=np.float32)

np.save("session_dff.npy", dff)
np.save("session_inferred_spikes.npy", spikes)
8. Inferred spike diagnostics
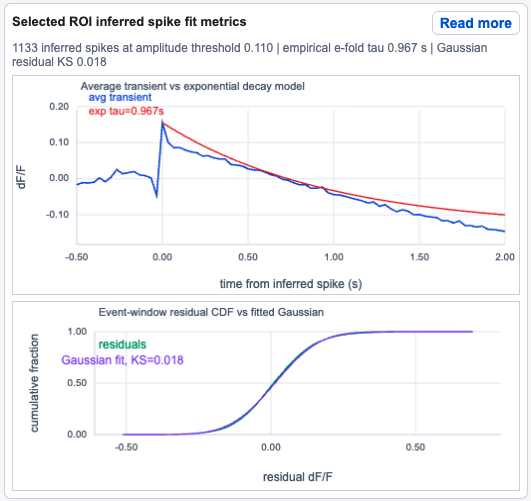
The inferred-spike diagnostics are viewer-side summaries of how the selected ROI's dF/F trace behaves around frames where the inferred-spike amplitude is above the active amplitude threshold. The current pipeline can generate those amplitudes with Suite2p's OASIS deconvolution, but the diagnostics only require an ROI-by-frame inferred-spike amplitude array. See the Suite2p deconvolution documentation and the OASIS paper for background on how Suite2p-style inferred-spike amplitudes are produced.
The amplitude threshold is a cutoff on the inferred-spike amplitude trace. Frames with amplitudes above the threshold are treated as events for plotting and metric calculation. For amplitudes, larger values mean the upstream deconvolution assigned stronger spike-like activity to that frame.
The event count is the number of threshold-passing inferred-spike frames used for the selected ROI diagnostics. For the selected-ROI diagnostic panel, events must have enough surrounding frames to build a peri-event window and events that occur within about 0.25 seconds of the previous accepted event are skipped so overlapping transients do not dominate the average.
The average transient is the mean dF/F waveform around accepted events. Each event window spans roughly 0.5 seconds before the event and 2 seconds after the event. The viewer subtracts a local pre-event baseline from each window before averaging, so the displayed curve is meant to show the typical event-locked dF/F shape for the selected ROI and threshold.
The exponential tau shown in the selected-ROI panel is an empirical decay
time constant for the average transient. The viewer finds the peak of the
average transient after the event, estimates the transient amplitude, and then
reports the time from that peak until the curve has decayed to about 1/e of
that amplitude. This is the same practical idea as an exponential e-folding
time constant, where a simple decay has the form:
amplitude(t) = amplitude_at_peak * exp(-time_since_peak / tau)
This tau is a descriptive fit diagnostic for the selected ROI, not a re-run of
the OASIS deconvolution model. The inferred-spike filter metrics also include
rise and decay tau values calculated from event-triggered dF/F windows: rise
tau is the time between crossing 10% and 90% of the average event amplitude,
and decay tau is the time from the average event peak until the transient falls
to 1/e of that amplitude.
The inferred-spike SNR is calculated from the average event-triggered dF/F waveform. It is the event amplitude divided by the standard deviation of the pre-event baseline in the average event window. Higher values indicate events that stand out more clearly from the pre-event baseline.
The residual dF/F values are local deviations of the dF/F trace around threshold-passing events. Around each event frame, the viewer marks a small event window and compares each marked dF/F sample with a local moving average. Those differences form the residual distribution shown in the lower diagnostic plot.
The Gaussian fit, KS value summarizes how close the event-window residuals are to a fitted Gaussian distribution. The viewer fits the Gaussian using the residual mean and standard deviation, builds the empirical cumulative distribution of the residuals, and reports the largest vertical distance between the empirical CDF and fitted Gaussian CDF. This is a Kolmogorov-Smirnov distance-style goodness-of-fit statistic. Lower values mean the residual distribution is closer to Gaussian under this simple check; higher values indicate heavier tails, skew, artifacts, overlapping events, or other structure left in the event-window residuals.
The Reset to ROI default threshold uses a precomputed per-ROI threshold chosen from candidate inferred-spike amplitude cutoffs. For each candidate, the summary code calculates event-window residuals and the Gaussian KS distance. The default is the candidate threshold with the smallest finite residual Gaussian-fit distance. This makes the default a data-driven display/QC threshold, not a claim that the chosen events are all true spikes.
The current diagnostics make several practical assumptions. Inferred-spike inputs are treated as nonnegative event amplitudes from OASIS or a compatible upstream method, with larger values representing stronger inferred spike-like activity. Event-triggered dF/F responses are assumed to be meaningfully alignable across events for the same ROI, so averaging them produces an interpretable transient shape. The decay summary assumes that the average event response has a positive peak and approximately monotonic decay after that peak; strongly multiphasic, overlapping, saturated, or motion-contaminated events can therefore make tau values misleading. The Gaussian residual metric assumes that, after local event structure is removed, residual deviations around events should look roughly Gaussian. KS distance also depends on the number and distribution of residual samples, so sessions or ROIs with very few usable events may have missing or unstable diagnostics.
9. Stacked dF/F traces
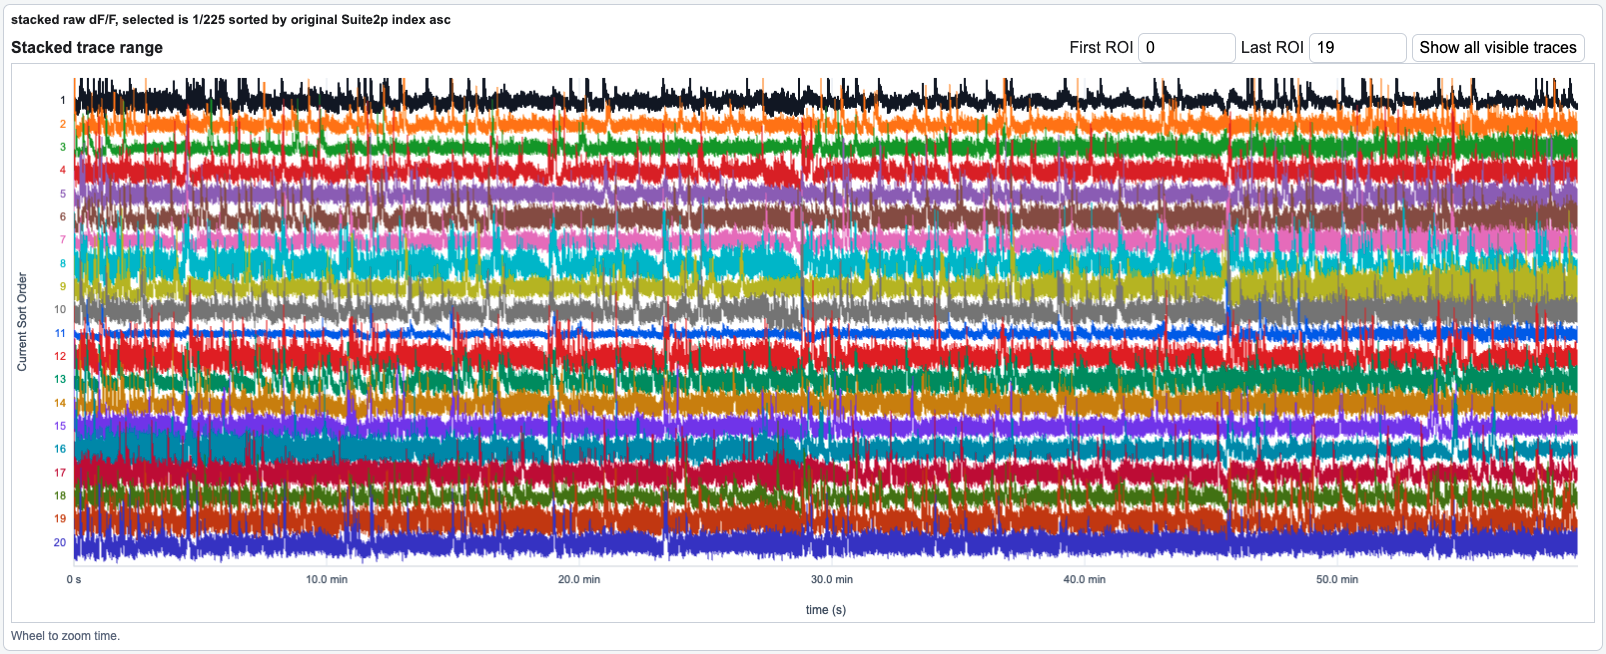
The stacked trace panel is a compact view of many ROI dF/F traces at once. It uses the current visible ROI list, so filtering, hiding labels, and sorting all change which traces appear and the order in which they are drawn. This makes it useful for checking whether a filter or sort produced a coherent group of ROIs before applying bulk labels or exporting results.
Each horizontal row corresponds to one visible ROI in the current sort order. The plotted signal is the ROI's dF/F trace over the active time window. The selected ROI is highlighted so it can be matched to the selected FOV outline and the larger single-ROI dF/F panel above. Clicking or stepping through ROIs updates the selected row, while changing filters or sort order can move the same ROI to a different row or remove it from the visible set.
The First ROI and Last ROI controls choose the visible row range within
the current filtered/sorted list, not original Suite2p ROI numbers. For example,
if a filter leaves 200 ROIs visible, setting First ROI to 0 and Last ROI to
49 shows the first 50 ROIs in that filtered/sorted ordering. Show all
visible traces expands the stacked panel back to the full visible set after a
manual row range has been applied.
The time axis is shared with the selected ROI trace and motion plots. Scrolling or dragging over the trace panels changes the active time window, and double-clicking resets the time view. This allows the stacked trace panel to be used both as a broad session scan and as a zoomed inspection view around a specific time period.
When inferred spikes are loaded, the stacked trace panel still draws dF/F traces rather than spike amplitudes. Use the selected ROI trace for the inferred-spike overlay and the inferred-spike diagnostics panel for threshold-specific event summaries. The stacked panel is mainly intended for visual comparison of trace shape, activity level, artifacts, and consistency across the currently visible ROI subset.
10. Motion correction plots
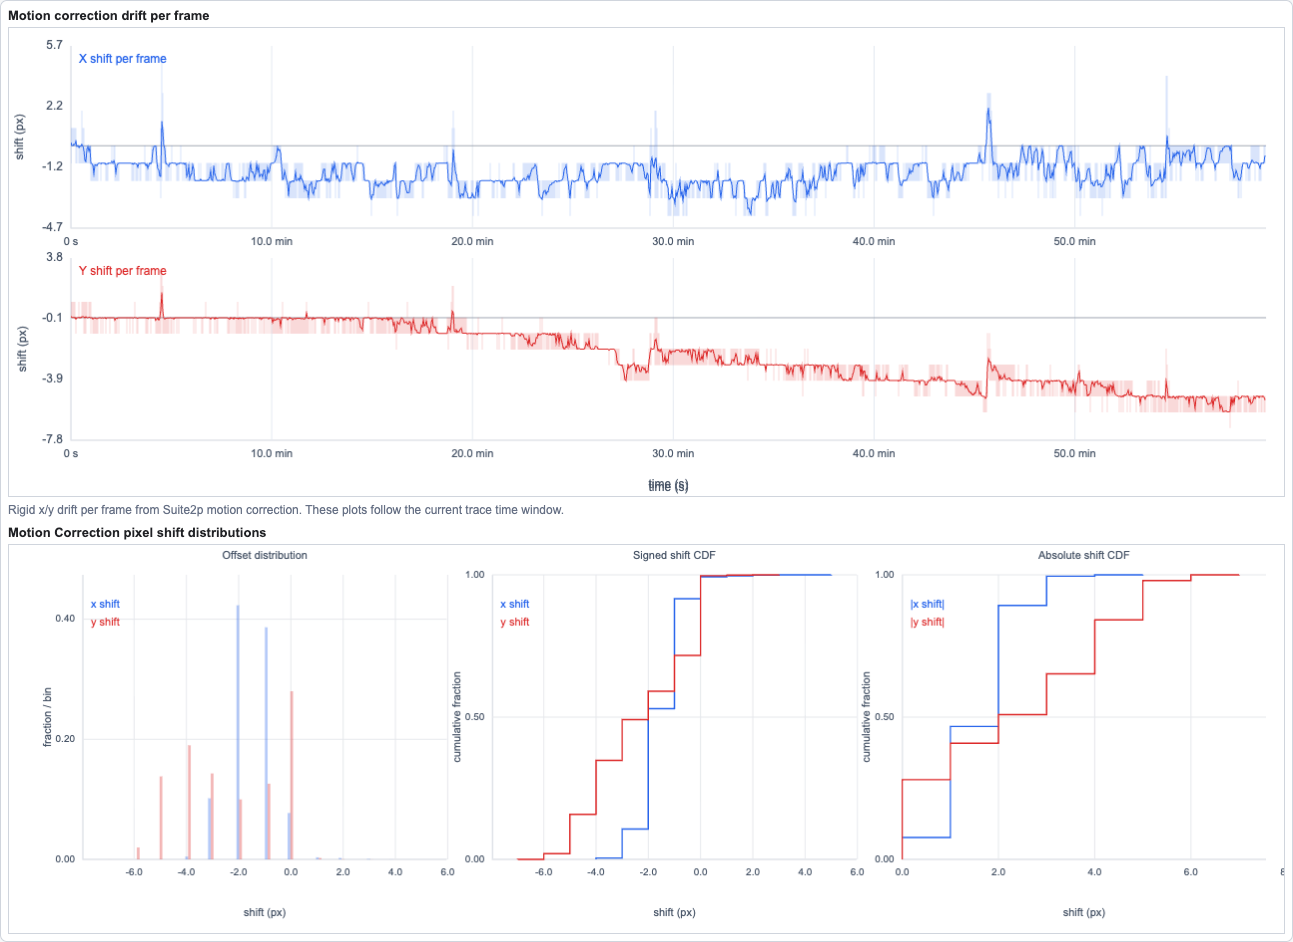
The motion correction area summarizes rigid frame shifts from the preprocessing stage. These plots are meant to help reviewers identify sessions or time ranges with large drift, abrupt registration jumps, or directional bias that could affect ROI traces and labels.
The drift plot has two stacked time-series panels. The top panel shows x shift per frame and the bottom panel shows y shift per frame, both in pixels. Positive and negative values indicate the direction of the rigid correction relative to the registered reference frame. The horizontal zero line marks no shift. The drift plot follows the same active time window as the selected ROI trace and stacked dF/F traces, so zooming or panning the trace time axis also updates the visible motion-correction time range.
The motion distribution plot summarizes the full-session motion offsets, not just the current zoomed time range. It contains three side-by-side panels. The Offset distribution shows the fraction of frames in each signed x/y shift bin, which helps reveal whether motion is tightly centered near zero or spread broadly across many pixel shifts. The Signed shift CDF shows the cumulative fraction of x/y shifts less than or equal to each signed shift value, making directional bias easier to see. The Absolute shift CDF shows the cumulative fraction of absolute x/y shifts and is useful for estimating what fraction of frames stayed within a given registration magnitude regardless of direction.
The controls are shared with the trace viewer. Use the mouse wheel on the drift plot to zoom the active time window, drag horizontally to pan through time, and double-click to reset the time window. The distribution plot does not have a separate time-window control because it is intended as a full-session summary.
The expected motion inputs are one-dimensional x/y offset arrays with one value per imaging frame:
shape = (n_frames,)

frame       0      1      2      ...      N
xoff      px     px     px               px
yoff      px     px     px               px
The summary generator first looks for a session-level move_offset.h5 file
with datasets named xoff and yoff:
/path/to/processed/session/
└── move_offset.h5
    ├── xoff    # one-dimensional x shift array, pixels
    └── yoff    # one-dimensional y shift array, pixels
If move_offset.h5 is not present, it falls back to xoff and yoff stored in
Suite2p's ops.npy:
/path/to/processed/session/
└── suite2p/
    └── plane0/
        └── ops.npy    # contains keys "xoff" and "yoff"
The arrays should be numeric and in frame order. If
xoff and yoff have different lengths, the interactive viewer uses the shared
overlap with the available dF/F frame count. If no valid offsets are found, the
motion panels remain visible but report that motion offsets are not available
for the session.
11. Bulk labeling

The Label all visible ROIs as ... dialog applies one manual label to the currently visible ROI set. Available bulk labels are Good, Bad, Unsure, and Not labeled. Because the action only affects visible ROIs, it is most useful after applying QC filters, changing the Show ROIs visibility settings, or sorting and restricting the displayed ROI range.
Bulk labeling is intended as a review accelerator rather than a replacement for manual inspection. After applying a bulk label, individual ROIs can still be revisited and assigned a different label.
12. Export and save options
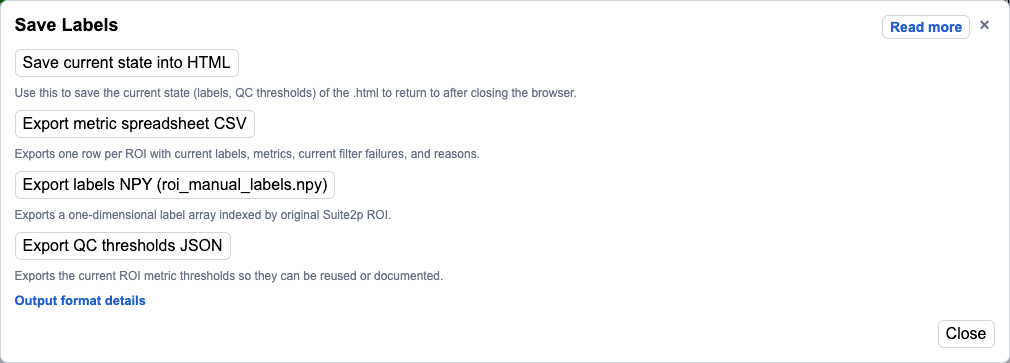
The Export section and Save Labels dialog provide the main ways to
preserve reviewer state and move results into downstream analysis. Save
current state into HTML writes a self-contained reviewer copy that preserves
current labels and custom filters. Export metric spreadsheet CSV writes one
row per ROI with labels, metrics, filter failures, and exclusion reasons.
Export labels NPY writes roi_manual_labels.npy, and Export QC thresholds
JSON saves the active metric thresholds for reuse or documentation.
12.1. Open ROI metric spreadsheet
Open ROI metric spreadsheet opens a browser table with one row per ROI. It is a review and audit view of the same ROI metrics used by the filtering and sorting controls, plus the current manual label state. The table includes the original Suite2p ROI index, manual label, optional cell-type label, morphology metrics, fluorescence trace metrics, inferred-spike metrics when available, and a reason column summarizing why the ROI is included or which active thresholds or labels currently mark it as failing.
The spreadsheet is generated from the current reviewer state at the moment the button is clicked. If you label ROIs as Good, Bad, Unsure, or Not labeled, those labels appear in the spreadsheet immediately when it is opened again. Active QC thresholds also affect the failure highlighting and reason text, so the spreadsheet is useful for checking exactly what the current filter settings are doing before saving labels or exporting thresholds.
The opened spreadsheet includes a Download CSV button. This produces the same metric-spreadsheet CSV available from the Save Labels dialog under Export metric spreadsheet CSV. The CSV is useful when you want a static copy of the table for analysis, review notes, or provenance.
Current exported fields:
| Column | Type | Description |
|---|---|---|
suite2p_index |
integer | Original Suite2p ROI index for this row. |
manual_label |
string | Current manual label: good, bad, unsure, or not labeled. |
cell_type_label |
string | Optional cell-type or indicator label when available; otherwise unset/unknown. |
cell_type_code |
nullable integer | Numeric cell-type code when available. Blank in the CSV when unavailable. |
footprint |
float | Fluorescence footprint metric used by QC filters. |
skew |
float | Fluorescence trace skew metric used by QC filters. |
aspect_ratio |
float | Morphology aspect-ratio metric. |
compact |
float | Morphology compactness metric. |
connectivity |
integer | Morphology connectivity/component count. |
roi_area_px |
float | ROI area in pixels. |
snr_95_50 |
float | Fluorescence trace SNR based on high-percentile versus median signal. |
caiman_exceptional_event_snr |
float | CaImAn-style large-transient SNR metric. |
autocorr_efold_time_seconds |
float | Fluorescence autocorrelation e-fold time in seconds. |
inferred_spike_snr |
nullable float | Event-triggered inferred-spike SNR when inferred spikes are available. |
inferred_spike_rise_tau_seconds |
nullable float | Inferred-spike event rise time metric in seconds. |
inferred_spike_decay_tau_seconds |
nullable float | Inferred-spike event decay/e-fold metric in seconds. |
inferred_spike_residual_gaussian_ks |
nullable float | Gaussian-fit KS distance for event-window residuals. Lower is closer to Gaussian. |
reason |
string | Semicolon-separated inclusion/failure notes from the current labels and active thresholds. |
The CSV file is plain text, so downstream tools may infer dtypes differently. When loading with pandas, treat blank numeric entries as missing values and cast label columns as strings or categoricals.
This spreadsheet does not by itself save manual labels back into the reviewer
HTML or write roi_manual_labels.npy. It only displays and optionally exports a
CSV snapshot of the current state. To preserve label edits after closing the
browser, use Save Labels. Save current state into HTML writes a reviewed
HTML copy that keeps the current labels and custom filters embedded in the file.
Export labels NPY writes roi_manual_labels.npy, the one-dimensional label
array used by downstream code. Export metric spreadsheet CSV writes the
spreadsheet snapshot with the same current labels, metrics, filter failures, and
reasons.
Generate the labeler and summary
The summary stage creates:
<session>_processing_summary.pdf
<session>_interactive_fov_roi_dff.html
Run the commands below from an environment where utils_2p is installed. The
shared PACE preprocessing environment already has the package available, so a
local 2p_imaging checkout is not required just to generate summaries. The
first positional argument can be a processed session root or a concrete data
directory, such as suite2p/plane0, suite2p/, qc_results/,
manual_qc_results/, or a directory containing external ROI masks and
fluorescence traces. For new sessions, use the native Suite2p layout. The
qc_results/ and manual_qc_results/ layouts are deprecated compatibility
inputs for older sessions.
Required processed-session files
At minimum, the processed session must contain:
/path/to/processed/session/
└── suite2p/
    └── plane0/
        ├── ops.npy
        ├── stat.npy
        ├── F.npy
        └── Fneu.npy
ops.npy must contain the functional mean image produced by Suite2p. An
existing iscell.npy is used when present for provenance, but the reviewer
opens with all Suite2p ROIs available and not labeled.
The summary generator can also read filtered qc_results-style outputs for
older sessions. When a session root is supplied in auto-detect mode, native
suite2p/plane0/ is preferred for new sessions. Deprecated qc_results/ and
manual_qc_results/ directories should be selected explicitly only when
reviewing older pre-filtered outputs:
/path/to/processed/session/
└── qc_results/
    ├── stat.npy       # filtered equivalent of suite2p/plane0/stat.npy
    ├── fluo.npy       # filtered equivalent of suite2p/plane0/F.npy
    ├── neuropil.npy   # filtered equivalent of suite2p/plane0/Fneu.npy
    └── iscell.npy     # optional
Use --input-layout suite2p, --input-layout qc_results,
--input-layout manual_qc_results, or --input-layout external_rois to make
the expected directory structure explicit. Use suite2p for new pipeline
outputs; qc_results and manual_qc_results are legacy layouts. The command
prints which layout it uses and the resolved paths for stat or ROI geometry,
fluorescence, neuropil, optional iscell.npy, and inferred spikes.
Direct input directories and layout detection
The generator now accepts a concrete input directory directly, which can be clearer than always pointing to the session root. These calls are equivalent when the corresponding files exist:
python -m utils_2p.processing_summary /path/to/session
python -m utils_2p.processing_summary /path/to/session/suite2p
python -m utils_2p.processing_summary /path/to/session/suite2p/plane0
python -m utils_2p.processing_summary /path/to/session/qc_results
python -m utils_2p.processing_summary /path/to/session/manual_qc_results
When the argument already points to a concrete layout directory, that directory
is used directly instead of searching the session root. For example,
/path/to/session/qc_results is interpreted as a filtered-output layout, while
/path/to/session/suite2p/plane0 is interpreted as native Suite2p output.
Filtered-output directories are legacy inputs; they are not created by default
for new sessions. The default output directory is the resolved session root
unless --output-dir is provided.
External ROI masks from non-Suite2p tools
The reviewer does not require ROIs to be detected by Suite2p. It requires a consistent ROI geometry and trace representation:
ROI row i -> pixels/weights in the displayed FOV coordinate frame
ROI row i -> fluorescence trace row i
The summary generator can convert external ROI masks into the Suite2p-like
stat.npy representation used internally by the HTML viewer. Point the summary
command at a directory with one ROI geometry file and matching traces:
/path/to/external_roi_session/
├── roi_mask.npy                 # dense integer label image, optional
├── spatial_components.npz       # sparse pixels x rois matrix, optional
├── F.npy or fluo.npy            # raw fluorescence, shape (n_rois, n_frames)
├── Fneu.npy or neuropil.npy     # optional neuropil, shape (n_rois, n_frames)
├── mean_func.npy                # optional FOV image, shape (Ly, Lx)
└── external_roi_metadata.json   # optional, mainly for sparse matrices
Use exactly one of these geometry inputs:
| File | Expected format |
|---|---|
roi_mask.npy, roi_masks.npy, label_mask.npy, or masks.npy |
Dense 2-D integer image. 0 is background. Positive labels are ROIs. |
spatial_components.npz, roi_spatial_components.npz, or A.npz |
SciPy sparse matrix with shape (pixels, n_rois) or (n_rois, pixels). Each column/row is a weighted ROI footprint. |
stat.npy |
Already-normalized Suite2p-like object array with ypix, xpix, and optional lam. |
For dense label masks, positive labels are converted in ascending label order.
For example, label value 1 becomes ROI row 0, label value 2 becomes ROI
row 1, and so on. The row order must match the row order in F.npy.
For sparse matrices, supply the FOV shape if no functional image file is present:
{
  "image_shape": [512, 512],
  "flatten_order": "F"
}
flatten_order controls how flattened pixel indices are mapped back to
(y, x) coordinates. CaImAn-style spatial matrices commonly use Fortran order
("F"), which is the default. Use "C" if the matrix was flattened in normal
NumPy row-major order.
The functional FOV image can be supplied as mean_func.npy, meanImg.npy,
mean_green.npy, or functional_mean.npy. Optional maximum-projection and
anatomical images can also be supplied with names such as max_func.npy,
max_proj.npy, mean_anat.npy, or mean_red.npy. If no FOV image is supplied
for a dense ROI mask, the summary uses the ROI mask extents to create a blank
background. That is enough to inspect masks and traces, but a real functional
mean image is strongly preferred because it verifies that the ROI coordinates
are in the same frame as the imaging data.
Example dense-mask input:
import numpy as np

roi_mask = np.zeros((512, 512), dtype=np.int32)
roi_mask[100:110, 200:230] = 1
roi_mask[250:270, 300:315] = 2

F = np.random.rand(2, 12000).astype("float32")
Fneu = np.zeros_like(F)
mean_func = np.random.rand(512, 512).astype("float32")

np.save("roi_mask.npy", roi_mask)
np.save("F.npy", F)
np.save("Fneu.npy", Fneu)
np.save("mean_func.npy", mean_func)
Generate the viewer:
python -m utils_2p.processing_summary \
  /path/to/external_roi_session \
  --input-layout external_rois
If the directory is already complete, --input-layout external_rois is optional
because the generator can auto-detect the external-ROI layout from the concrete
input directory. If Fneu.npy or neuropil.npy is omitted, the summary
generator treats neuropil as zero.
Metrics calculated for external masks
When an external mask is converted, the summary pipeline fills the same morphology-style fields that the reviewer uses for Suite2p ROIs:
| Metric | Source for external ROIs |
|---|---|
roi_area_px / npix |
Number of pixels assigned to the ROI. |
connectivity |
Number of 4-connected components in the ROI mask. |
aspect_ratio |
Bounding-box elongation: longer side divided by shorter side. |
compact |
Perimeter-based compactness: perimeter² / (4π × area). |
footprint |
Fraction of the ROI bounding box occupied by ROI pixels. |
skew |
Skewness of the corresponding raw fluorescence trace row. |
These fallback values make non-Suite2p ROIs sortable and filterable in the same
viewer menus. They are compatible review metrics, not exact reproductions of
Suite2p's internal definitions for fields such as compact or footprint.
When a real stat.npy already contains Suite2p-derived values, those values
are preserved.
To make reviewer-side morphology presets available in the viewer, the session should contain:
/path/to/processed/session/
└── processing_pipeline_parameters.json
Older sessions may instead store preset metadata in
qc_results/qc_parameters.json. masks.h5 is optional and supplies
anatomical images when available.
Optional cell-type or indicator labels
The reviewer can display, filter, sort, and export optional cell-type or indicator labels. These are separate from manual ROI QC labels. They are meant for labels such as red/inhibitory versus non-red/excitatory status, or an equivalent binary indicator classification from upstream processing.
When generating the summary, the script looks for precomputed cell-type labels in this order:
/path/to/processed/session/
├── suite2p/
│   └── plane0/
│       └── roi_cell_type_labels.npy
├── roi_cell_type_labels.npy
└── masks.h5    # optional dataset named "labels"
The preferred file is roi_cell_type_labels.npy. It should be a one-dimensional
NumPy array with one value per original Suite2p ROI:
shape = (n_rois,)

ROI index      0      1      2      ...      M
label code    -1      1    NaN               0
Supported values are:
| Value | Meaning in reviewer |
|---|---|
1 |
inhibitory/red |
-1 |
excitatory/non-red |
0 |
unsure |
NaN |
not loaded / unavailable for that ROI |
Example:
import numpy as np

cell_type_labels = np.full(n_rois, np.nan, dtype=np.float32)
cell_type_labels[red_roi_indices] = 1
cell_type_labels[non_red_roi_indices] = -1
cell_type_labels[uncertain_roi_indices] = 0

np.save("roi_cell_type_labels.npy", cell_type_labels)
If labels are stored in masks.h5 as a dataset named labels, the dataset must
contain the same -1, 0, 1, or NaN coding. When its length matches the
current ROI count, labels are used directly. When the labels appear to be
indexed to qc_results/stat.npy, the summary tries to map them back to the
original Suite2p ROI order.
Cell-type labels can also be loaded after the HTML is open by using the Upload cell-type labels control in the ROI QC filters menu. The upload file can be CSV, TSV, or plain text with a delimited table. It must contain a header row and these columns:
cell_type_code,cell_type_label
It may also contain one of these index columns:
suite2p_index
roi
index
When an index column is present, rows are mapped by original Suite2p ROI index.
When no index column is present, row order is used and the file must contain
exactly one data row per ROI in the reviewer. cell_type_code accepts -1,
0, or 1. cell_type_label accepts equivalent text labels such as
excitatory, excitatory/non-red, non-red, exc, inhibitory,
inhibitory/red, red, inh, unsure, uncertain, or unknown.
Example indexed CSV:
suite2p_index,cell_type_code,cell_type_label
0,1,inhibitory/red
1,-1,excitatory/non-red
2,0,unsure
3,,unknown
Uploaded cell-type labels update the current browser session immediately and are included in the ROI metric spreadsheet. To preserve them in a reviewed HTML copy, use Save Labels and then Save current state into HTML after uploading.
Generate locally
python -m utils_2p.processing_summary /path/to/processed/session
The PDF and interactive HTML are written into the processed session directory.
To force a specific legacy input layout:
python -m utils_2p.processing_summary \
  /path/to/processed/session \
  --input-layout qc_results
Generate on PACE
Submit summary generation as a small CPU job instead of running it on a PACE login node:
sbatch \
  --account=gts-fnajafi3 \
  --qos=embers \
  --cpus-per-task=4 \
  --mem=24G \
  --time=02:00:00 \
  --job-name=processing_summary \
  --wrap="module load anaconda3/2023.03 && conda activate /storage/project/r-fnajafi3-0/shared/shared_envs/2p_processing_suite2p_1x && python -m utils_2p.processing_summary /path/to/processed/session"
Generate as part of the preprocessing pipeline
The full PACE preprocessing pipeline includes the summary stage by default:
python -m utils_2p.processing_pipeline submit \
  --session /path/to/raw/session \
  --output-root /path/to/processed_outputs \
  --target-structure soma
Use --target-structure soma for soma/cell-body recordings or
--target-structure dendrite for dendritic recordings. This selects the
Suite2p default argument set; channel count and functional channel are inferred
from the raw session files unless overridden.
To regenerate only the summaries for an existing pipeline output:
python -m utils_2p.processing_pipeline submit \
  --session /path/to/raw/session \
  --output-root /path/to/existing_processed_outputs \
  --target-structure soma \
  --stages summary
The processed session must be located at
/path/to/existing_processed_outputs/<raw-session-directory-name>/.
Export format and downstream use
The interactive HTML contains the original Suite2p ROI set. By default, every Suite2p ROI opens as not labeled, and no morphology/QC filter is applied. Reviewer-side morphology presets, including relaxed dendrite filters when available, remain available for manual testing in the viewer.
The reviewer can label ROIs manually, apply a morphology/custom metric filter, or use Label all as ... → Not labeled to return every visible Suite2p ROI to the not-labeled state.
All ROIs detected by Suite2p
        |
        v
Optional morphology/custom metric filters
        |
        v
Manual Good / Bad / Unsure / Unlabeled review
        |
        v
reviewed HTML or roi_manual_labels.npy
The reviewer can save the current labels back into a self-contained reviewed HTML copy with Save labels into HTML. Reopening that saved HTML restores the labels embedded in the file. Use Save roi_manual_labels.npy when downstream scripts need a portable ROI mask file.
Custom morphology presets use the same explicit-save model. Save preset adds the current threshold values to the open page, Save preset into HTML saves a reviewed HTML copy that will reopen with that custom preset available, and Export preset JSON / Import preset JSON move a preset between sessions.
roi_manual_labels.npy
This file is a one-dimensional NumPy array with one value per original Suite2p ROI. The row index is the original Suite2p ROI index before morphology or manual filtering:
array([
    1.0,     # Suite2p ROI 0: good
    0.0,     # Suite2p ROI 1: bad
    2.0,     # Suite2p ROI 2: unsure
    nan,     # Suite2p ROI 3: not labeled
])
Values are:
| Value | Meaning |
|---|---|
NaN |
not labeled |
0 |
bad |
1 |
good |
2 |
unsure |
The number of rows must match the original Suite2p ROI count, so
roi_manual_labels[i] is always the manual label for original Suite2p ROI i.
The reviewer initializes every Suite2p ROI as not labeled, so values are NaN
unless the reviewer labels ROIs manually or applies labels from a filter.
Place the reviewed file beside the original Suite2p files:
/path/to/session/
└── suite2p/
    └── plane0/
        ├── F.npy
        ├── Fneu.npy
        ├── iscell.npy
        └── roi_manual_labels.npy
Load reviewed dF/F
With roi_manual_labels.npy in suite2p/plane0/, load manually reviewed Good
ROIs in a script or notebook:
from utils_2p.roi_labels import load_reviewed_dff

session = load_reviewed_dff("/path/to/session")
dff = session["dff"]
roi_indices = session["roi_indices"]
dff has shape (selected_rois, frames). roi_indices contains the
corresponding original Suite2p ROI indices.
To include Unsure ROIs with Good ROIs, use:
session = load_reviewed_dff("/path/to/session", policy="good_or_unsure")
When roi_manual_labels.npy is stored elsewhere, pass its path:
session = load_reviewed_dff(
    "/path/to/session",
    label_path="/path/to/roi_manual_labels.npy",
)
Use policy="good_or_unsure" to include Unsure ROIs with Good ROIs, or
policy="not_bad" to include Good, Unsure, and Not Labeled ROIs. The companion
notebook contains the same example:
utils_2p/roi_reviewer_exports.ipynb.